This guide contains one section for each of the add-in's key functionality areas, followed by a reference guide to all the Excel functions available in the add-in.
Looking to quickly get started? Each section starts with a "quickstart" guide.
→
Looking for a specific excel function? Use the search box in the table of contents on the left.
XLKitLearn is compatible with Excel for Windows, Mac, and the web. In Excel, open Home → Add-ins → More Add-ins, search for XLKitLearn, and add it to your workbook.
Fit and compare predictive models, evaluate their performance, and score new observations directly from Excel.
Quickstart
→
Are you currently taking CBS's Business Analytics core class? That class does not use XLKitLearn's Predict module—instead, it directly uses XLKitLearn's machine-learning prediction functions. Click here for details.
Imagine you run a pizza shop and want to give customers more accurate delivery estimates. In this quickstart, you'll use XLKitLearn's Predict module to learn from 100 completed orders and estimate delivery times based on distance, order size, rain, time of day, and driver experience. Along the way, you'll train and evaluate a model, then use it to predict delivery times for new orders. Follow along with the steps below...
→→→→→→→→→→
Step 1 of 11
Open
Open the Predict tab
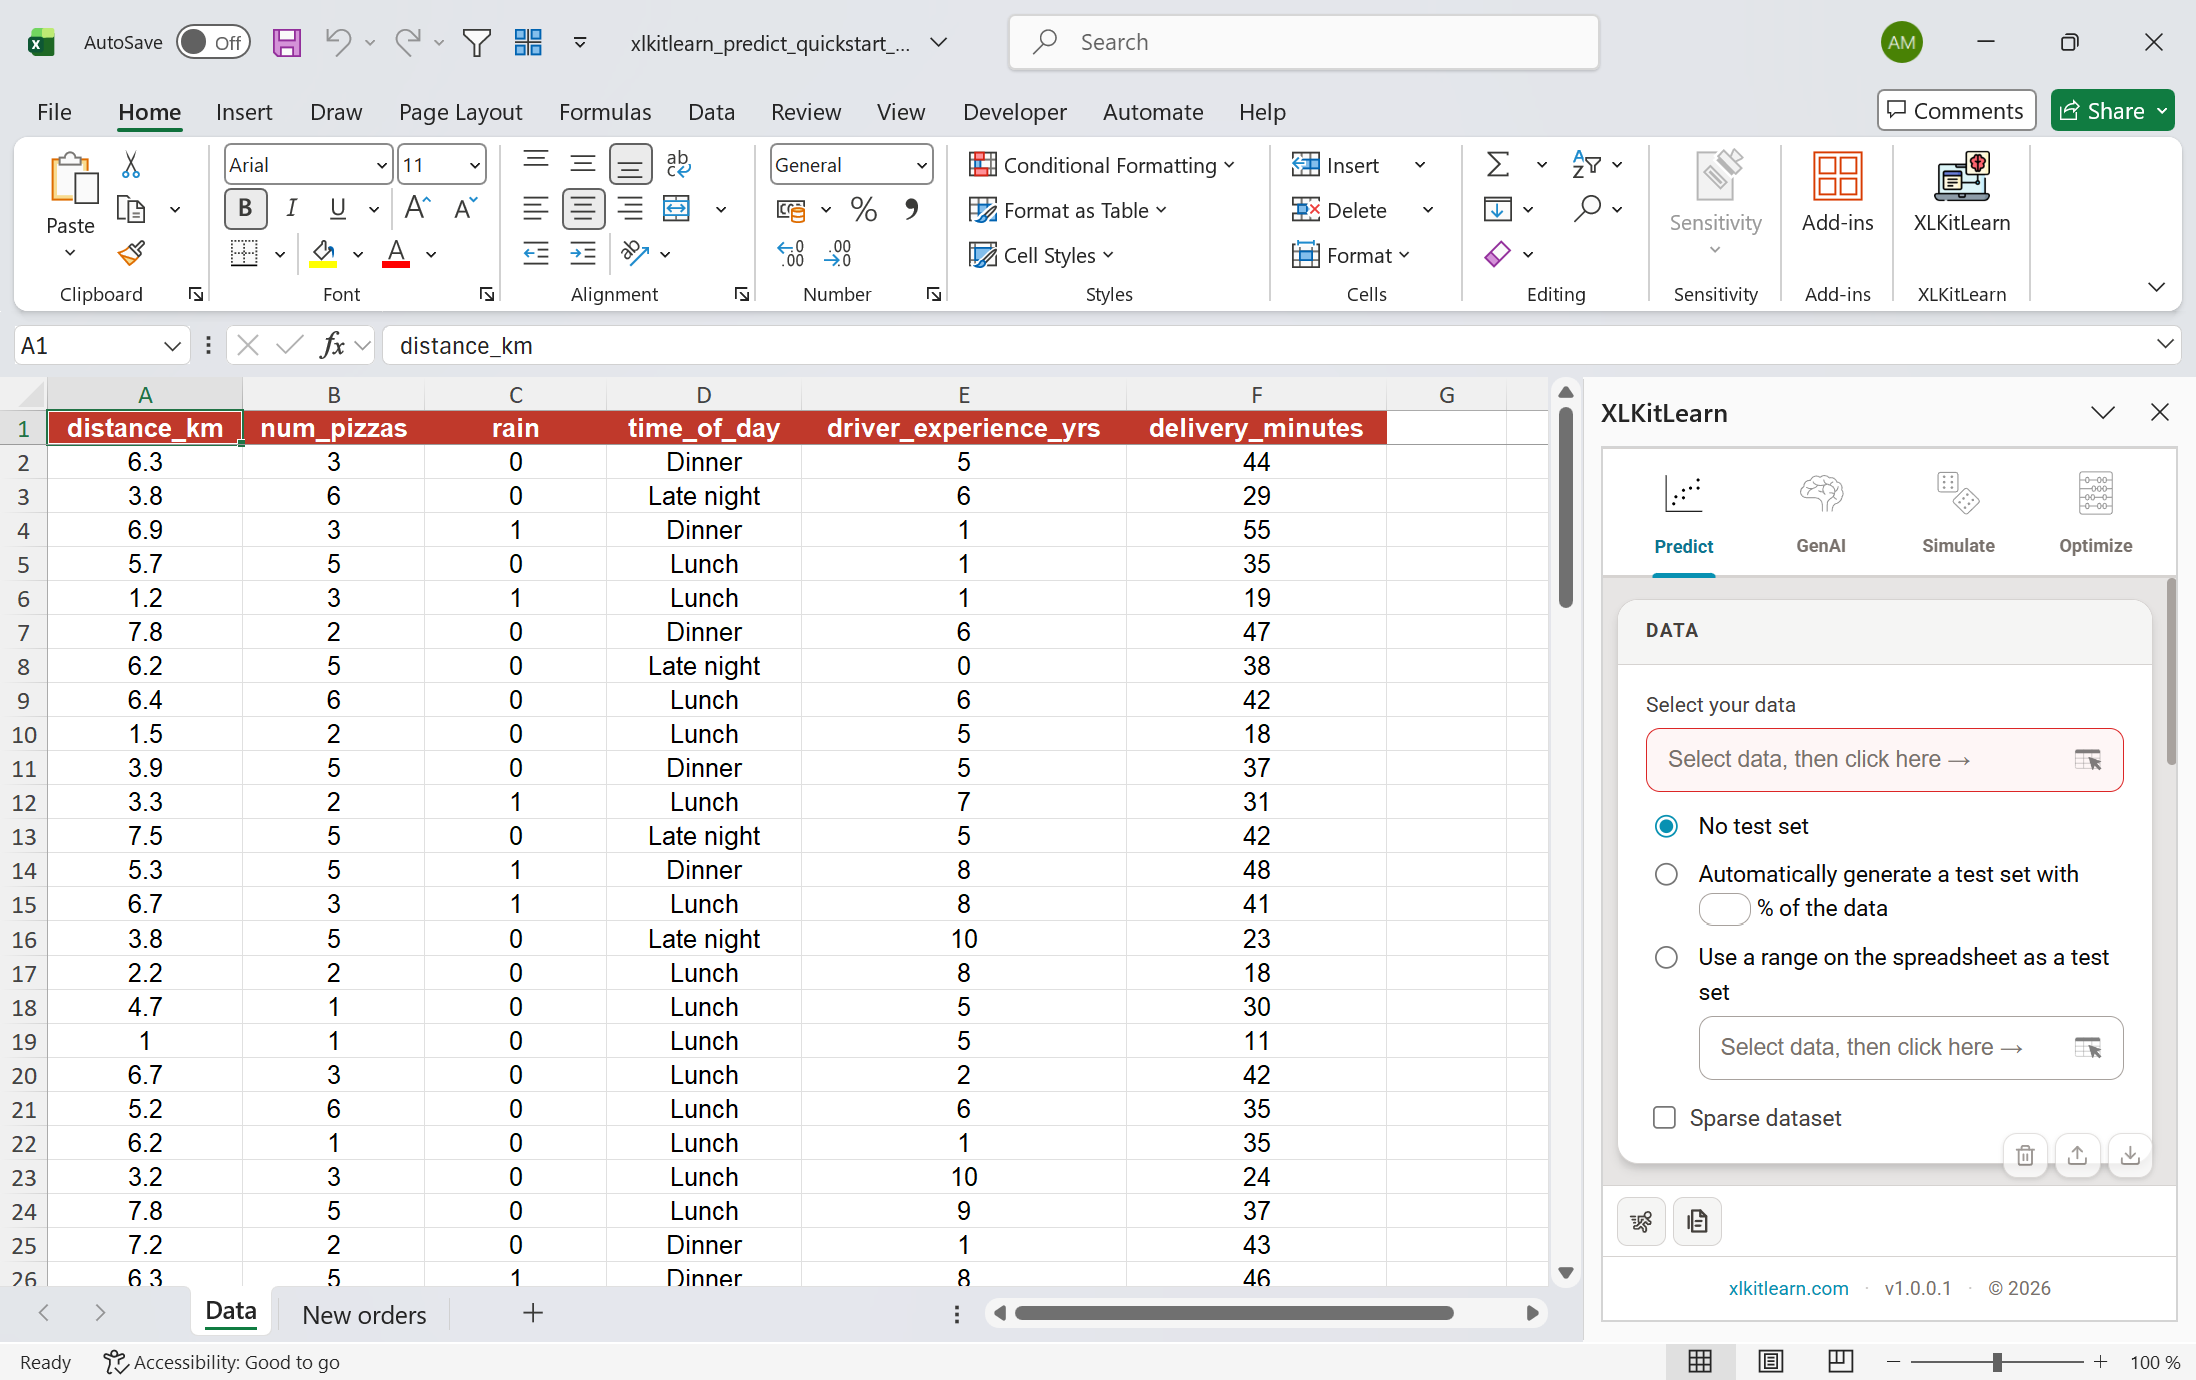
Download the sample workbook by clicking here, and open it. The "Data" tab contains the 100 completed pizza orders we will use to predict delivery times (the last column). Each row represents one completed order; each column describes that order, such as its distance, number of pizzas, weather, or delivery time.
On Excel's Home tab, click XLKitLearn. The add-in pane opens on the right.
At the top of the pane, click Predict.
Data
Select your data
Go to the Data sheet and select cells A1:F101, including the header row. The predict module always requires you to select the header rows, so that it knows what your column names are.
In Tell the add-in where your data is by clicking on the table icon at the right of the "Select your data" textbox. The range of your data appears in the textbox.
XLKitLearn does not support missing data - if any of the cells in your data are blank, the add-in will not run.
Test set
Choose a test set
A test set is a group of orders the model does not see while learning. It lets us measure how well the model predicts delivery time for genuinely new orders.
Select Automatically generate a test set and enter 20. The add-in will randomly reserve 20% of the orders for testing. You may use any whole number from 1 to 99.
No test set uses every row for training but cannot assess performance on unseen data. Use a range on the spreadsheet lets you supply a separate test dataset.
Regression
Choose regression or classification
Scroll down to Model(s), and select the kind of model you want to fit. Regression models predicts continuous numbers, like delivery time. Classification models predict a categories, such as “Late” or “On time.”
Because we are predicting a continuous variable here - delivery time - leave the switch set to regression.
Model
Pick a model
A model is a method for learning patterns from data. Different models find those patterns in different ways.
Open the menu and choose Linear/logistic regression for the purposes of this quickstart guide.
Formula
Write the model formula
The model formula specifies the dependent variable ("y-variable" or "outcome variable") and independent variables ("x-variables" or "predictor variables"). It takes the form outcome ~ predictors.
In the formula box, type delivery_minutes ~ . The dot means “use every other column”, so this formula tells XLKitLearn to predict delivery times using every other column in the data.
The list on the left contains the name of every column in your data. As you type column names in your formula, the list will narrow down to variables you may be searching for; you can use your up and down arrows to change the selection, and then press Tab to auto-complete when you have selected the variable you are looking for. Notice that XLKitLearn turns the name of each variable into a small blue pill.
To use only certain columns as predictors, you can specify them directly in the formula, separated by plus signs. For example: delivery_minutes ~ distance_km + num_pizzas + rain.
XLKitLearn's formula language is extremely versatile - it can, for example, automatically create dummy variables when they are needed, like in the "time of day" column here, which contains text rather than numbers. See below for more information on what XLKitLearn's formula language can do.
Options
Set model and output options
Some models require hyperparameters to be specified, such as the number of neighbors in k-nearest-neighbors. If so, these can be specified here. For the sake of our simple linear regression, leave this box blank.
Keep Include model parameters selected so the output shows the coefficients in your linear regression, p-values, and confidence intervals.
Keep Output model object selected so XLKitLearns outputs a model object that you can use to predict delivery times for new orders - we will discuss this later.
The randomization seed makes your result reproducible. Running the add-in twice using the same randomization seed will always produce exactly the same answer. Leave it at 123 for now.
XLKitLearn allows you to select the name of the sheet you want to output your results to. Enter Pizza Model in this textbox. If you leave it blank, the add-in chooses an arbitrary name (such as "Sheet 1").
Click the run button (partially obscured in the screenshot above)
Run
Run XLKitLearn
A progress dialog reports what the add-in is doing. Simple models usually finish within a few seconds; larger datasets and models may take longer.
To stop the run, click Cancel.
If the setup contains an error, such as a misspelled column in the formula, the add-in explains what to correct.
Output
Read the output
When training finishes, a new worksheet named Pizza Model appears with the results.
Scoring method tells you how XLKitLearn scores your model. For regression models like this one, XLKitLearn uses the R-squared. For classification models, it uses the AUC (area under the curve). The closer these numbers are to 1, the better.
The in-sample score (around 0.93) measures the performance of the model on orders used for training. It is often higher than the model's performance on new data.
Out-of-sample score (about 0.92) measures performance of the model on the reserved 20%. This score is more representative of how well the model will perform on future orders.
This table contains the coefficients for our linear regression, together with p-values and confidence intervals. For example, each extra kilometer adds about 4 minutes to delivery times, rain adds about 7.5 minutes, and each year of driver experience saves about half a minute. These effects are all statistically significant. Time-of-day effects are measured relative to dinner. Stars in the sig column flag stronger statistical evidence.
Notice that dummy variables were automatically created for the "time of day" column, which contained text values. The first category alphabetically (dinner) is used as the "base" category, and every other number is relative to this base category. So it looks like late night deliveries take 9 minutes less than dinner deliveries.
The prediction table lists all orders in the test set containing 20% of the data. It compares each test order's actual delivery time with the model's prediction. For example, the first listed order took 18 minutes and was predicted at about 16 minutes.
New orders
Make predictions for new orders
Go to the New orders tab.
This tab contains a table with five new orders. For these orders, we have the predictors, but not the outcomes. We now want to use these data to predict the outcome for these new orders.
One way to do this is to type out the full formula for the linear regression, using the coefficients in the Pizza Model sheet. Unfortunately, this won't work for more complex models - XLKitLearn provides a more general way to make predictions that will work for any model.
Select cell F1 and type =XKL.PREDICT( to invoke XLKitLearn's prediction function. It accepts two arguments - the first is the model object, which is on the Pizza Model sheet, in cell D10. The second is the new data, which is on this sheet in cells A1:E6. Once you have typed in or selected those ranges as in the screenshot above, type ) to close the function call, and press Enter.
A Prediction column will appear. One formula returns predictions for the entire dataset; you do not need to drag it down. The first order — 6.4 km away at lunch — is predicted to take about 36 minutes.
The new data must use the same headers as the training data. Extra columns are ignored.
Settings
Saving, importing, or clearing settings
To clear the settings on the predict tab and start afresh, click on the small trash can at the bottom right of the tab.
To export the settings on the predict tab (for example, if you want to send them to someone else) click on the small down arrow at the bottom right of the tab. A long piece of text will be copied to your clipboard, containing all the settings you input into the add-in in machine readable form.
To import settings you have previously saved and load them into the predict tab, click on the small up arrow at the bottom right of the tab. The add-in will ask you to paste a settings string you saved in the previous step
If you do not have a settings string but want to load the add-in settings that were used to produced a specific output from the add-in, simply select a cell containing an XLKitLearn settings object (these are always output every time you run the add-in). then, click the "Import" button - the settings will automatically be imported from that cell.
Guide · GenAI
GenAI
User manual coming soon
Guide · Simulate
Simulate
User manual coming soon
Guide · Optimize
Optimize
User manual coming soon
Reference guide
Function reference
The list below is a comprehensive list of every function in the add-in. Use the search on the left to filter these functions.
Spilled range
Click to run
Machine learning - model fitting
Fit reusable models and use them to generate predictions for new data.
XKL.FITLINEARREGRESSION▼
Fit a linear regression model from a table and either a formula or an outcome-column name. Returns a reusable model with a complete coefficient table in its coefficients property.
Parameters
data
Training data including a header row. Column names are used by the formula.
formula
A model formula such as y ~ x1 + x2, or just the outcome-column name to use every other column as a predictor.
Returns
Returns an XLKitLearn Model entity with a complete coefficient table that is accessible through its coefficients property.
Working example
Paste the contents of your clipboard into Cell A1 of a worksheet
XKL.FITLOGISTICREGRESSION▼
Fit a logistic regression model from a table and either a formula or an outcome-column name. The outcome must contain at most two distinct values, and every value must be the number 0 or 1.
Parameters
data
Training data including a header row. Column names are used by the formula.
formula
A model formula such as y ~ x1 + x2, or just the outcome-column name to use every other column as a predictor.
Returns
Returns an XLKitLearn Model entity with a complete coefficient table that is accessible through its coefficients property.
Working example
Paste the contents of your clipboard into Cell A1 of a worksheet
XKL.FITKNN▼
Fit a k-nearest-neighbors model from a table and either a formula or an outcome-column name. Numeric outcomes produce a regressor and nonnumeric outcomes produce a classifier.
Parameters
data
Training data including a header row. Column names are used by the formula.
formula
A model formula such as y ~ x1 + x2, or just the outcome-column name to use every other column as a predictor.
k
The positive whole number of nearest neighbors to use.
row_to_excludeoptional
Optional training-data row to leave out of the fitted model. Row 1 is the first row after the header.
Returns
Returns an XLKitLearn Model entity that can be passed to predict.
Working example
Paste the contents of your clipboard into Cell A1 of a worksheet
Machine learning - helpers
Evaluate model performance, inspect classification results, and transform data for modeling and visualization.
XKL.RSQUARED▼
Calculate the coefficient of determination (R-squared) using scikit-learn's r2_score.
Parameters
y_true
A row or column containing the observed numeric values.
y_pred
A row or column containing the predicted numeric values, in the same observation order as y_true.
Returns
Returns the same R-squared value as sklearn.metrics.r2_score.
Working example
Paste the contents of your clipboard into Cell A1 of a worksheet
XKL.RMSE▼
Calculate root mean squared error using scikit-learn's mean_squared_error.
Parameters
y_true
A row or column containing the observed numeric values.
y_pred
A row or column containing the predicted numeric values, in the same observation order as y_true.
Returns
Returns the square root of sklearn.metrics.mean_squared_error.
Working example
Paste the contents of your clipboard into Cell A1 of a worksheet
XKL.AUC▼
Calculate binary or multiclass ROC AUC using scikit-learn. Class labels are converted to text and sorted in ascending Python string order, matching XLKitLearn model fitting. For binary data, a score vector must contain the probability of the second (larger) class in that sorted order. For a probability table, columns must follow the complete sorted class order. Multiclass AUC uses one-vs-one averaging.
Parameters
y_true
A row or column containing the observed class labels.
y_pred
Either one probability per observation for the larger of two sorted classes, or a probability table with one row per observation and one column per class in ascending Python string-sort order.
Returns
Returns the same binary ROC AUC or one-vs-one multiclass ROC AUC as sklearn.metrics.roc_auc_score.
Working example
Paste the contents of your clipboard into Cell A1 of a worksheet
XKL.CONFUSIONMATRIX
Spills
▼
Create a confusion matrix from observed and predicted class labels. Labels are converted to text and sorted in ascending order.
Parameters
y_true
A row or column containing the observed class labels.
y_pred
A row or column containing the predicted class labels, in the same observation order as y_true.
Returns
Returns a table whose rows are observed classes, columns are predicted classes, and cells contain observation counts.
Working example
Paste the contents of your clipboard into Cell A1 of a worksheet
XKL.ROCCURVE
Spills
▼
Calculate a binary ROC curve from observed class labels and prediction scores, using at most 20 distinct score thresholds.
Parameters
y_true
A row or column containing the observed labels for exactly two classes.
y_pred
A row or column containing the predicted probability or score for the second class in ascending string-sort order.
Returns
Returns a two-column table headed False positive rate and True positive rate.
Working example
Paste the contents of your clipboard into Cell A1 of a worksheet
XKL.PREDICT
Spills
▼
Use an XLKitLearn model entity to make predictions for new rows of data. The input data should include column headers matching the variables the model was trained on.
Parameters
model
XLKitLearn Model entity returned by fitLinearRegression or by the main XLKitLearn modeling workflow.
data
Rows to score, including a header row. Use the same feature column names and compatible data types as the training data.
Returns
Returns a spilled prediction table with a header row. Regression output is headed Prediction; classification output is headed by the model's class levels.
Working example
Paste the contents of your clipboard into Cell A1 of a worksheet
XKL.MDS
Spills
▼
Perform multidimensional scaling (MDS) to reduce high-dimensional numeric data to two dimensions. Use this to create coordinates for visualizing similarity or distance among rows.
Parameters
data
Numeric data to reduce, with one row per item and one column per original dimension. Do not include headers.
seedoptional
Optional random seed for reproducible coordinates. Defaults to 123.
n_initoptional
The number of random initializations to try
Returns
Returns a two-column spilled matrix of MDS coordinates, one row per input row.
Working example
Paste the contents of your clipboard into Cell A1 of a worksheet
XKL.SIGMOID
Spills
▼
Calculate the sigmoid of a number 1 / (1 + exp(-x))
Parameters
x
The number to calculate the sigmoid of
Returns
Returns the sigmoid of the numbers input
Working example
Paste the contents of your clipboard into Cell A1 of a worksheet
GenAI - core
Send prompts to language models and create embeddings through OpenRouter.
XKL.LLM
Click to run
▼
Ask a model from OpenRouter to respond to a prompt, continue from a previous LLM Output entity, call workbook tools, or return a structured response. New model calls require Click to run from the GenAI tab.
Parameters
message
Prompt or conversation context. Pass a single cell for one prompt, or a vertical range containing prompt text and prior LLM Output entities to continue a conversation.
modeloptional
Optional OpenRouter model ID or alias. Leave blank to use openrouter/auto. Supported aliases include chatgpt, claude, gemini, grok, and deepseek; full IDs from the OpenRouter model list also work.
toolsoptional
Optional range of LLM Tool entities created by functions such as sqlTool, runPythonTool, sendEmailTool, or googleMapsPlacesSearchTool. Tools cannot be used in the same call as response_format.
response_formatoptional
Optional structured output format. Pass one or more Response format field entities from getResponseFormatField, or pass one of the simple strings integer, boolean, or number. Cannot be used in the same call as tools.
reasoningoptional
Reasoning effort for models that support it. Use higher effort for harder analysis and lower or none for faster, cheaper simple tasks.
temperatureoptional
Sampling temperature between 0 and 2. Lower values are more focused and repeatable; higher values are more varied. Defaults to the model/provider behavior.
max_tokensoptional
Optional maximum number of output tokens to generate. Some models do not support this parameter. Default value will be 5000.
auto_tool_runoptional
TRUE to automatically run any tool calls returned by the model. FALSE to return Tool Call entities in the .tool_calls table so you can run each call manually with its corresponding Tool function.
Returns
Returns an LLM Output entity. Use dot notation to pull these fields into cells:
Content: the model's text response
.tool_calls: a table of function names, IDs, and Tool Call entities
field_<field name>: each named structured-output value
Usage, cost, timing, model, provider, and reasoning metadata
Hidden continuation JSON used when the entity is passed into another llm call
For large outputs, inspect the entity in the side bar.
Working example
Paste the contents of your clipboard into Cell A1 of a worksheet
XKL.EMBED
Click to run
▼
Create an embedding vector for text, or for an image when the chosen embedding model supports images. This function is staged when it would make a new model call: after the formula shows Ready to run, select it and click Run staged cells in selection in the GenAI tab of the side bar.
Parameters
text
Text to embed, or an Excel image entity when using an image-capable embedding model.
modeloptional
Embedding model to use. Leave blank or use openai for openai/text-embedding-3-small; use gemini for google/gemini-embedding-2-preview; or provide another OpenRouter embeddings model ID.
Returns
Returns an Embedding entity with token count, cost, timing, model/provider metadata, and a hidden Embedding value. Use dot notation on the returned entity to spill the numeric vector for similarity search, clustering, or downstream modeling.
Working example
Paste the contents of your clipboard into Cell A1 of a worksheet
GenAI - helpers
Define structured responses, inspect tokenization, and analyze token probabilities.
XKL.GETRESPONSEFORMATFIELD▼
Create one named field for a structured LLM response. Use this helper when you want llm to return predictable fields instead of free-form text: create one field per value you want back, then pass the resulting cells to the response_format argument of llm.
Parameters
short_name
Short field name to use in the structured output. Keep it simple, unique, and spreadsheet-friendly, for example category, score, or reasons.
parameter_type
Data type the model should return for this field: integer, number, string, or boolean.
descriptionoptional
Plain-language instruction for the model explaining what belongs in this field. Be specific about units, allowed values, and how to handle uncertainty.
is_listoptional
TRUE if this field should contain a list of values. Leave blank or FALSE for a single value.
Returns
Returns a Response format field entity. Pass one or more of these entities into llm as response_format; use the shorter strings integer, number, or boolean when you only need one simple scalar output.
Working example
Paste the contents of your clipboard into Cell A1 of a worksheet
XKL.TOKENIZE
Spills
▼
Split text into model-style tokens using the local cl100k_base tokenizer. This is useful for estimating prompt length, inspecting how text is tokenized, or teaching tokenization behavior without making an API call.
Parameters
text
Text, number, or boolean value to tokenize. It is converted to text before tokenization.
Returns
Returns a single spilled row containing one decoded token per column.
Working example
Paste the contents of your clipboard into Cell A1 of a worksheet
XKL.LLMPROBS
Spills
Click to run
▼
Generate up to 100 tokens with GPT-4.1 and show token-by-token probability alternatives. This function is staged when it would make a new model call: after the formula shows Ready to run, select it and click Run staged cells in selection in the GenAI tab of the side bar.
Parameters
message
Single prompt to send to the model. Use plain text, a number, or a boolean; conversation entities and ranges are not supported here.
Returns
Returns a formatted spill range. The left columns contain prompt, completion, model, provider, date, cache status, token usage, and cost; the remaining columns show each selected output token and the top alternative tokens with probabilities.
Working example
Paste the contents of your clipboard into Cell A1 of a worksheet
GenAI - tools
Connect language models and worksheets to messaging, email, Python, SQL, maps, weather, market data, flights, and location services.
XKL.SENDTEXT
Click to run
▼
Send a US SMS text message from the workbook. This function is staged for safety: after entering the formula, the cell shows Ready to run; select it and click Run staged cells in selection in the GenAI tab of the side bar to actually send the message.
Parameters
phone_numberoptional
Recipient phone number in US E.164 format: +1 followed by 10 digits, for example +12125551234.
messageoptional
Message body to send. Use ASCII text only; common smart quotes and dashes are normalized, and the final message must be 159 characters or less.
wait_for_replyoptional
TRUE to wait up to about 3 minutes for the first reply before returning. Leave blank or FALSE to return as soon as the text is sent.
Returns
Returns a Text message entity containing the text ID, recipient, message, and optionally the first reply or a reply-timeout flag. Use getTextResponses later with the text ID to check for additional replies.
Working example
Paste the contents of your clipboard into Cell A1 of a worksheet
XKL.SENDTEXTTOOL▼
Create an LLM tool that lets llm send SMS text messages. Pass the returned LLM Tool entity into the tools argument of llm; the model can then call sendText when it has the recipient number and message.
Parameters
tool_calloptional
Optional LLM Tool call entity from an LLM Output .tool_calls table. When provided, this function runs that sendText call instead of returning a tool descriptor.
Returns
Returns an LLM Tool entity. The tool requires a US +1 phone number and a message, and supports an optional wait-for-reply flag.
Working example
Paste the contents of your clipboard into Cell A1 of a worksheet
XKL.GETTEXTRESPONSES▼
Fetch replies received for a previously sent text message. Use the text ID returned by sendText; this is useful when you sent without waiting, or when you want to check for later replies.
Parameters
text_idoptional
Text ID returned by sendText.
Returns
Returns a Text responses entity. In Excel, the card lists replies and exposes a hidden Responses table that can be pulled out with dot notation; outside Excel it returns a JSON array of response strings.
Working example
Paste the contents of your clipboard into Cell A1 of a worksheet
XKL.GETTEXTRESPONSESTOOL▼
Create an LLM tool that lets llm look up replies to a sent text message. Pass this LLM Tool entity into the tools argument of llm when the model may need to check a conversation by text ID.
Parameters
tool_calloptional
Optional LLM Tool call entity from an LLM Output .tool_calls table. When provided, this function runs that getTextResponses call instead of returning a tool descriptor.
Returns
Returns an LLM Tool entity for retrieving SMS replies by text ID.
Working example
Paste the contents of your clipboard into Cell A1 of a worksheet
XKL.SENDEMAIL
Click to run
▼
Send an email from the workbook, optionally continuing an existing thread and optionally waiting for a reply. This function is staged for safety: after entering the formula, select the Ready to run cell and click Run staged cells in selection in the GenAI tab of the side bar to actually send the email.
Parameters
send_to_addressoptional
Recipient email address.
email_subjectoptional
Subject line. If left blank, the message is sent with (no subject).
email_textoptional
Body text of the email. If left blank, the message body is (no message).
wait_for_replyoptional
TRUE to wait up to about 3 minutes for a reply before returning. Leave blank or FALSE to return as soon as the email is sent.
thread_tokenoptional
Optional thread token from a previous sendEmail result. Provide it to continue the same email thread.
Returns
Returns an Email entity containing the message ID, thread token, recipient, subject, body, and optionally a reply or reply-timeout flag. Save the thread token if you want to continue or inspect the conversation later.
Working example
Paste the contents of your clipboard into Cell A1 of a worksheet
XKL.SENDEMAILTOOL▼
Create an LLM tool that lets llm send emails. Pass the returned LLM Tool entity into the tools argument of llm; the model can then call sendEmail when it has the recipient and message details.
Parameters
tool_calloptional
Optional LLM Tool call entity from an LLM Output .tool_calls table. When provided, this function runs that sendEmail call instead of returning a tool descriptor.
Returns
Returns an LLM Tool entity for sending email. The tool requires a recipient address and can optionally set subject, body, wait-for-reply, and thread token.
Working example
Paste the contents of your clipboard into Cell A1 of a worksheet
XKL.GETEMAILTHREAD▼
Fetch the full message history for an email thread. Use the thread token returned by sendEmail to review all messages in the conversation.
Parameters
thread_tokenoptional
Thread token returned by sendEmail.
Returns
Returns an Email thread entity. In Excel, the card shows each message and exposes a hidden Messages table with number, sender, subject, date, and content; outside Excel it returns JSON.
Working example
Paste the contents of your clipboard into Cell A1 of a worksheet
XKL.GETEMAILTHREADTOOL▼
Create an LLM tool that lets llm fetch an email thread by thread token. Pass this LLM Tool entity into the tools argument of llm when the model may need to inspect a conversation.
Parameters
tool_calloptional
Optional LLM Tool call entity from an LLM Output .tool_calls table. When provided, this function runs that getEmailThread call instead of returning a tool descriptor.
Returns
Returns an LLM Tool entity for retrieving email thread history by thread token.
Working example
Paste the contents of your clipboard into Cell A1 of a worksheet
XKL.RUNPYTHON▼
Run Python code in the workbook's Python worker and return the value of the last expression as JSON. Use this for quick calculations, data reshaping, or analysis that is easier in Python than in formulas.
Parameters
code
Python code to execute. The last statement should be an expression whose value can be serialized to JSON; convert NumPy and pandas values to plain Python lists, dicts, floats, ints, or strings before returning.
Returns
Returns the JSON-serialized value of the final Python expression, or a friendly Python error entity if execution fails. If the last statement is not an expression, the return value is JSON null.
Working example
Paste the contents of your clipboard into Cell A1 of a worksheet
XKL.RUNPYTHONTOOL▼
Create an LLM tool that lets llm run Python code for calculations and data analysis. Pass the returned LLM Tool entity into the tools argument of llm when a model should be able to compute rather than only reason in text.
Parameters
tool_calloptional
Optional LLM Tool call entity from an LLM Output .tool_calls table. When provided, this function runs that runPython call instead of returning a tool descriptor.
Returns
Returns an LLM Tool entity for Python execution. The tool expects code whose final expression is JSON-serializable.
Working example
Paste the contents of your clipboard into Cell A1 of a worksheet
XKL.SQLDATATABLE▼
Package an Excel range as a named table that can be queried with DuckDB SQL. Use this once per source table, then pass the resulting SQL Data Table entities to sql or sqlTool.
Parameters
table
Range containing the table. The first row must contain unique, nonblank column names, and column names cannot contain double quotes.
table_name
SQL table name to use in queries. It must start with a letter and contain only letters, numbers, and underscores.
descriptionoptional
Optional description of the table and any columns whose meaning is not obvious. This is especially helpful when the table is exposed to llm through sqlTool.
Returns
Returns a one-cell SQL Data Table entity. The entity stores the source range, table name, description, and inferred column types; pass these entities to sql for direct querying or to sqlTool so an LLM can query the data.
Working example
Paste the contents of your clipboard into Cell A1 of a worksheet
XKL.SQL
Spills
▼
Run a DuckDB SQL query against one or more Excel ranges packaged by sqlDataTable. Use this when you want a normal spilled table result in Excel.
Parameters
sql_code
DuckDB SQL statement to run. Refer to each source range by the table_name you gave to sqlDataTable.
tables
One or more SQL Data Table entities created by sqlDataTable.
max_response_sizeoptional
Optional maximum serialized response size used when this query is exposed as an LLM tool. Defaults to 2000.
Returns
Returns a spilled table with column headers. Dates are converted to readable date strings and SQL NULL values appear as blanks when called from Excel.
Working example
Paste the contents of your clipboard into Cell A1 of a worksheet
XKL.SQLTOOL▼
Create an LLM tool that lets llm query selected Excel tables with DuckDB SQL. Use sqlDataTable to define each source table first, then pass those entities here, and pass the returned LLM Tool entity into llm as a tool.
Parameters
tablesoptional
One or more SQL Data Table entities created by sqlDataTable. Each table name must be unique. To run a pending SQL call manually, this argument may instead be its LLM Tool call entity.
max_response_sizeoptional
Optional maximum serialized response size to tell the tool to allow. Defaults to 2000.
tool_calloptional
Optional LLM Tool call entity from an LLM Output .tool_calls table. When provided, this function runs that sql call instead of returning a tool descriptor.
Returns
Returns an LLM Tool entity that includes the SQL schema, table descriptions, and fixed table references. Give the tool to llm so the model can write SQL and inspect workbook data without copying the full data into the prompt.
Working example
Paste the contents of your clipboard into Cell A1 of a worksheet
XKL.GOOGLEMAPSPLACESSEARCH
Click to run
▼
Search Google Maps Places with a plain-language query and return normalized place details. This function is staged because it calls an external service: after the formula shows Ready to run, select it and click Run staged cells in selection in the GenAI tab of the side bar.
Parameters
query
Plain-language search text, for example Columbia University, pizza near Boston, or pharmacies near 10027.
restriction_latitudeoptional
Optional latitude for a circular location bias. Provide with restriction_longitude and restriction_radius_meters.
restriction_longitudeoptional
Optional longitude for a circular location bias. Provide with restriction_latitude and restriction_radius_meters.
restriction_radius_metersoptional
Radius in meters for the location bias. Required if restriction_latitude and restriction_longitude are set; maximum 50000.
included_typeoptional
Optional place type filter. If set, only places with that exact Google place type are returned.
open_nowoptional
TRUE to return only places Google reports as currently open.
Returns
Returns a Google Maps places search entity with cost, result count, and a hidden results table. Results include place_id, display name, addresses, latitude, longitude, Google Maps URI, business status, phone, website, rating, and rating count.
Working example
Paste the contents of your clipboard into Cell A1 of a worksheet
XKL.GOOGLEMAPSPLACESSEARCHTOOL▼
Create an LLM tool that lets llm search Google Maps Places. Pass the returned LLM Tool entity into the tools argument of llm when the model may need to find businesses, addresses, or place IDs before taking another action.
Parameters
tool_calloptional
Optional LLM Tool call entity from an LLM Output .tool_calls table. When provided, this function runs that googleMapsPlacesSearch call instead of returning a tool descriptor.
Returns
Returns an LLM Tool entity for Google Maps place search. The tool returns normalized place records and billed cost metadata.
Working example
Paste the contents of your clipboard into Cell A1 of a worksheet
XKL.GOOGLEMAPSTRAVELTIME
Click to run
▼
Compute route duration and distance between two Google place IDs. This function is staged because it calls an external service: after the formula shows Ready to run, select it and click Run staged cells in selection in the GenAI tab of the side bar.
Parameters
origin_place_id
Raw Google origin place ID, such as the place_id returned by googleMapsPlacesSearch.
destination_place_id
Raw Google destination place ID, such as the place_id returned by googleMapsPlacesSearch.
travel_modeoptional
Travel mode. Defaults to DRIVE.
consider_trafficoptional
TRUE to request traffic-aware routing. Only supported for DRIVE.
departure_timeoptional
Optional RFC 3339 departure timestamp, for example 2026-05-12T15:01:23Z. Do not provide together with arrival_time.
arrival_timeoptional
Optional RFC 3339 arrival timestamp. Google only uses arrival time for TRANSIT routes. Do not provide together with departure_time.
unitsoptional
Distance units. Defaults to IMPERIAL.
Returns
Returns a Google Maps route entity with duration, static_duration, distance, route description, warnings, traffic flag, and billed cost. Use place IDs from Places search rather than addresses for the most reliable routing.
Working example
Paste the contents of your clipboard into Cell A1 of a worksheet
XKL.GOOGLEMAPSTRAVELTIMETOOL▼
Create an LLM tool that lets llm compute Google Maps route time and distance between place IDs. Pair it with the Places search tool when the model first needs to look up place IDs.
Parameters
tool_calloptional
Optional LLM Tool call entity from an LLM Output .tool_calls table. When provided, this function runs that googleMapsTravelTime call instead of returning a tool descriptor.
Returns
Returns an LLM Tool entity for route duration and distance. The tool requires origin and destination place IDs and supports mode, traffic, time, and units options.
Working example
Paste the contents of your clipboard into Cell A1 of a worksheet
XKL.GOOGLEMAPSWEATHER
Click to run
▼
Get current weather or an hourly forecast for a latitude/longitude from Google Maps Weather. This function is staged because it calls an external service: after the formula shows Ready to run, select it and click Run staged cells in selection in the GenAI tab of the side bar.
Parameters
latitude
Latitude of the location, between -90 and 90.
longitude
Longitude of the location, between -180 and 180.
units_systemoptional
Units system. Defaults to IMPERIAL.
forecast_untiloptional
Optional New York date/time through which to return hourly forecast data, formatted YYYY-MM-DD,HH:MM. Leave blank for current conditions only.
Returns
Returns a Google Maps weather entity. Current weather exposes condition, temperature, feels_like, humidity, UV index, precipitation, wind, and cloud cover; forecasts expose a hidden forecast_hours table with those fields by hour.
Working example
Paste the contents of your clipboard into Cell A1 of a worksheet
XKL.GOOGLEMAPSWEATHERTOOL▼
Create an LLM tool that lets llm get current or forecast weather for a latitude/longitude. Pass the returned LLM Tool entity into llm when the model may need weather context.
Parameters
tool_calloptional
Optional LLM Tool call entity from an LLM Output .tool_calls table. When provided, this function runs that googleMapsWeather call instead of returning a tool descriptor.
Returns
Returns an LLM Tool entity for Google Maps weather. The tool requires latitude and longitude and can optionally request an hourly forecast through a New York time cutoff.
Working example
Paste the contents of your clipboard into Cell A1 of a worksheet
XKL.GETSTOCKPRICES
Spills
Click to run
▼
Fetch daily OHLCV stock prices for one or more equity tickers. This function is staged because it calls an external service: after the formula shows Ready to run, select it and click Run staged cells in selection in the GenAI tab of the side bar.
Parameters
tickers
One or more stock ticker symbols. Select a row or column of tickers to request several at once; symbols are normalized to uppercase.
from
Start date as YYYY-MM-DD, or an Excel date cell.
to
End date as YYYY-MM-DD, or an Excel date cell. Must be after from and at least 24 hours ago.
Returns
Returns a spilled table with columns ticker, date, open, high, low, close, and volume. Multiple tickers are stacked in the same output table.
Working example
Paste the contents of your clipboard into Cell A1 of a worksheet
XKL.GETSTOCKPRICESTOOL▼
Create an LLM tool that lets llm fetch daily stock prices. Pass the returned LLM Tool entity into the tools argument of llm when the model may need historical OHLCV data.
Parameters
tool_calloptional
Optional LLM Tool call entity from an LLM Output .tool_calls table. When provided, this function runs that getStockPrices call instead of returning a tool descriptor.
Returns
Returns an LLM Tool entity for daily stock prices. The tool requires tickers, from date, and to date.
Working example
Paste the contents of your clipboard into Cell A1 of a worksheet
XKL.FLIGHTSEARCH
Click to run
▼
Search Duffel flight availability for a one-way, round-trip, or multi-city itinerary. This function is staged because it calls an external service: after the formula shows Ready to run, select it and click Run staged cells in selection in the GenAI tab of the side bar.
Parameters
cabin_class
Cabin class for the search: economy, premium_economy, business, or first.
allow_connection
TRUE to allow one connection per leg; FALSE to search nonstop options only.
from_iataoptional
Origin IATA airport code for a simple one-way or round-trip search. Use with to_iata and outbound_date instead of legs.
to_iataoptional
Destination IATA airport code for a simple one-way or round-trip search. Use with from_iata and outbound_date instead of legs.
outbound_dateoptional
Outbound departure date formatted YYYY-MM-DD. Use with from_iata and to_iata instead of legs.
return_dateoptional
Optional return departure date formatted YYYY-MM-DD. Only used with from_iata, to_iata, and outbound_date.
legsoptional
Detailed flight legs for multi-city or constrained searches. Use a table with columns origin, destination, departure_date, and optional departure_time_from, departure_time_to, arrival_time_from, arrival_time_to. Use 3-letter IATA codes and YYYY-MM-DD dates.
Returns
Returns a Duffel flight search entity with Search ID and a hidden Results table. For multi-leg searches, choose a result's leg_id and pass the Search ID plus selected leg path to flightSearchNextLeg to retrieve the next leg options.
Working example
Paste the contents of your clipboard into Cell A1 of a worksheet
XKL.FLIGHTSEARCHTOOL▼
Create an LLM tool that lets llm search Duffel flight availability. Pass the returned LLM Tool entity into llm when the model may need to find flights or compare itineraries.
Parameters
tool_calloptional
Optional LLM Tool call entity from an LLM Output .tool_calls table. When provided, this function runs that flightSearch call instead of returning a tool descriptor.
Returns
Returns an LLM Tool entity for flight search. The tool supports either simple from/to/date fields or an ordered list of detailed legs with optional time windows.
Working example
Paste the contents of your clipboard into Cell A1 of a worksheet
XKL.FLIGHTSEARCHNEXTLEG
Click to run
▼
Continue a Duffel multi-leg flight search after selecting a previous leg option. This function is staged because it calls an external service: after the formula shows Ready to run, select it and click Run staged cells in selection in the GenAI tab of the side bar.
Parameters
search_id
Search ID returned by flightSearch.
previous_legs
Selected previous leg path from the result leg_id values, for example 1 or 1.2.5.
Returns
Returns a Duffel next-leg search entity with the same Search ID and a hidden Results table for the next leg. Continue passing the growing previous_legs path until the itinerary is complete.
Working example
Paste the contents of your clipboard into Cell A1 of a worksheet
XKL.FLIGHTSEARCHNEXTLEGTOOL▼
Create an LLM tool that lets llm continue a Duffel flight search after selecting a previous leg. Use it together with the flight search tool for multi-leg itineraries.
Parameters
tool_calloptional
Optional LLM Tool call entity from an LLM Output .tool_calls table. When provided, this function runs that flightSearchNextLeg call instead of returning a tool descriptor.
Returns
Returns an LLM Tool entity for retrieving next-leg flight options by Search ID and previous leg path.
Working example
Paste the contents of your clipboard into Cell A1 of a worksheet
XKL.IPINFO
Spills
▼
Get the workbook user's public IP address, approximate location, and time zone. Use this when you need coarse location context, not precise GPS coordinates.
Returns
Returns a two-column key/value table with fields from the IP lookup service, such as IP address, city, region or metro code, country, continent, and timezone when available.
Working example
Paste the contents of your clipboard into Cell A1 of a worksheet
XKL.IPINFOTOOL▼
Create an LLM tool that lets llm look up the workbook user's public IP address, approximate location, and time zone. Use this only for coarse context; it is not a precise geolocation tool.
Parameters
tool_calloptional
Optional LLM Tool call entity from an LLM Output .tool_calls table. When provided, this function runs that ipInfo call instead of returning a tool descriptor.
Returns
Returns an LLM Tool entity for IP-based location lookup. The tool takes no arguments and returns approximate location metadata.
Working example
Paste the contents of your clipboard into Cell A1 of a worksheet
Simulation
Generate random values from commonly used probability distributions for simulation models.
XKL.SIMNORMAL▼
Generate a normally distributed simulation value.
Parameters
mean
Mean of the distribution.
standard_deviation
Standard deviation; must be greater than zero.
Returns
A normally distributed random value.
Working example
Paste the contents of your clipboard into Cell A1 of a worksheet
XKL.SIMBINOMIAL▼
Generate a binomially distributed simulation value.
Parameters
trials
Number of independent trials; must be a nonnegative integer.
probability
Success probability for each trial, from zero to one.
Returns
A binomially distributed random integer.
Working example
Paste the contents of your clipboard into Cell A1 of a worksheet
XKL.SIMPOISSON▼
Generate a Poisson-distributed simulation value.
Parameters
mean
Expected number of events; must be nonnegative.
Returns
A Poisson-distributed random integer.
Working example
Paste the contents of your clipboard into Cell A1 of a worksheet
XKL.SIMEXPONENTIAL▼
Generate an exponentially distributed simulation value.
Parameters
rate
Event rate (lambda); must be greater than zero. The mean is 1 / rate.
Returns
An exponentially distributed random value.
Working example
Paste the contents of your clipboard into Cell A1 of a worksheet
XKL.SIMUNIFORM▼
Generate a uniformly distributed simulation value.
Parameters
minimum
Smallest possible value.
maximum
Largest possible value; must exceed the minimum.
Returns
A uniformly distributed random value.
Working example
Paste the contents of your clipboard into Cell A1 of a worksheet
XKL.SIMTRIANGLE▼
Generate a triangularly distributed simulation value.
Parameters
minimum
Smallest possible value.
most_likely
Mode of the distribution, between the minimum and maximum.
maximum
Largest possible value; must exceed the minimum.
Returns
A triangularly distributed random value.
Working example
Paste the contents of your clipboard into Cell A1 of a worksheet
Utilities
Perform common worksheet transformations, set operations, counts, and positional lookups.
XKL.GETCOUNTS
Spills
▼
Find the unique values in the range provided, and the number of times each value occurs.
Parameters
values
The values we're trying to summarize
summary_typeoptional
Whether to return counts (COUNTS) or percentages (PERCENTAGES)
case_sensitiveoptional
Whether text values with different capitalization should be counted separately. Defaults to TRUE.
Returns
Returns two columns with headings. The first contains the unique values in the input range, and the second contains the count or proportion for that value, sorted from largest to smallest.
Working example
Paste the contents of your clipboard into Cell A1 of a worksheet
XKL.SUBTRACTSETS
Spills
▼
Return the unique values from the first range that do not appear in the second range.
Parameters
first_range
The range whose unique values should be returned.
second_range
The range whose values should be removed from the first set.
Returns
Returns a single-column spilled range containing the set difference, in first-appearance order.
Working example
Paste the contents of your clipboard into Cell A1 of a worksheet
XKL.ARGMAX▼
Find the position of the nth largest value in a vector.
Parameters
vector
The numeric values to search.
labelsoptional
Optional labels corresponding to the vector. When provided, returns the selected label instead of its position.
noptional
Which ranked value to return. Defaults to 1.
Returns
Returns the 1-indexed position of the requested value, or its corresponding label when labels are provided.
Working example
Paste the contents of your clipboard into Cell A1 of a worksheet
XKL.ARGMIN▼
Find the position of the nth smallest value in a vector.
Parameters
vector
The numeric values to search.
labelsoptional
Optional labels corresponding to the vector. When provided, returns the selected label instead of its position.
noptional
Which ranked value to return. Defaults to 1.
Returns
Returns the 1-indexed position of the requested value, or its corresponding label when labels are provided.
Working example
Paste the contents of your clipboard into Cell A1 of a worksheet